
A size chart is part of the buying decision, not a decorative image added at the end of a product page. When it is unclear, out of date, or attached to the wrong products, shoppers either guess or leave. A short quality-assurance pass before publishing catches the errors that matter most.
This checklist is designed for merchants, catalog teams, and agencies. It does not assume a particular ecommerce platform. The goal is to make each chart understandable without customer support and specific enough to help someone compare a product with their own measurements.

Photo: kellyhogaboom, CC BY-SA 2.0, via Flickr.
1. Confirm the chart belongs to the product
Start with product scope. Does this chart apply to the exact item, an entire collection, or only a particular fit family? A loose unisex tee, a fitted women’s top, and a children’s hoodie should not silently share a chart simply because they all use S through XL labels. If a chart covers several products, list the product names or the rule that connects them.
The product title, photography, description, and chart must tell the same story. If the listing calls an item cropped, oversized, compression, wide-fit, or lined, that information should be visible near the size table. A shopper should not have to infer a major fit characteristic from an image.
2. Label every measurement and unit
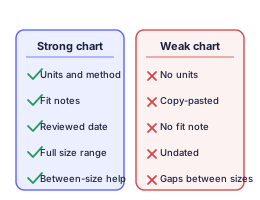
Every column needs a name and a unit. “Length” is ambiguous unless the chart says body length, garment length, foot length, inseam, or rise. “Width” is ambiguous unless it says flat width or circumference. If the chart offers inches and centimetres, convert and check both values from one source of truth; do not maintain two unrelated tables.
Use a visible note for the method: “measured flat,” “body measurement,” “heel to toe,” or “around the fullest part.” A simple measuring diagram is often more helpful than another paragraph. On mobile, the table must scroll horizontally or reflow cleanly instead of shrinking into unreadable type.
3. Check the numbers as a system
Read the rows from smallest to largest. Do the values progress logically? Are there accidental unit changes, misplaced decimal points, copied rows, or missing ranges? Compare the table with the source used to create it and keep a versioned record of that source. This is especially important when suppliers change a pattern, a brand updates a size range, or a store imports a revised product feed.
Where a dimension is not relevant, leave it out rather than filling the chart with zeros or placeholder dashes. A shoe chart may need length and width; a ring chart may need diameter and circumference; a dress chart may need bust, waist, hip, and length. Relevant information is more valuable than a crowded table.
4. Give shoppers a decision path
A size table alone cannot answer every edge case. Add a brief fit note that explains what to do between sizes, how fabric stretch affects fit, and which measurement should control the decision. Avoid unsupported claims such as “runs small” unless they are tied to a specific product, a documented measurement change, or the brand’s own guidance.
For example, a useful note might say: “Choose by hip measurement for this rigid woven skirt; the waist has no stretch.” That tells the shopper what to compare and why. An unhelpful note says only “true to size,” because it gives no method and means different things to different people.
5. Test the page like a shopper
Open the product page on a phone, tablet, and desktop. Can you find the chart without scrolling through unrelated promotion? Does it open without covering the Add to Cart control? Can a keyboard user reach it? Does the chart remain readable at 200% zoom? Are linked guides and return terms still valid?
Then test the content journey: choose a size using only the page, compare it with a known item, and identify where you felt uncertain. That uncertainty is usually a cue to improve a label, measurement diagram, or fit note—not to add more generic marketing copy.
6. Keep an editorial record
For every chart, record the owner, source, review date, measurement method, and products covered. When an update arrives, log what changed. This makes corrections easier and gives support teams a defensible answer when a customer reports a mismatch.
SizeChartBase uses the same principle on its public references: each guide should identify its independent status, explain the method, and link to the current official source where one is available. See our editorial methodology for the full approach.
Before publishing
- The chart is assigned to the correct product or product family.
- Every value has a label, unit, and defined measurement method.
- The table has been checked against the current source.
- Fit notes explain the controlling measurement and relevant stretch or layering.
- The mobile version is readable and usable.
- The page contains a current return or exchange path.
- A source and review record are stored with the chart.
This kind of QA will not remove all returns—fit is personal—but it replaces guessing with a transparent, repeatable decision process.
Example: a useful chart handoff record
The record does not need to be a lengthy report. A useful handoff for a new rigid cotton skirt might read: “Product family: A-line skirt SS-24; source: supplier specification sheet dated 2026-08-12; chart type: finished garment circumference; waist measured at waistband, hip measured 20 cm below waistband; reviewer: catalog lead; version: 1.2; fit note: choose by hip, no waist stretch.”
That one record answers the questions that otherwise become support tickets. It tells the next editor which products may use the chart, what the numbers describe, how they were measured, and why the fit note says what it says. If the supplier revises the pattern, the team creates version 1.3 rather than overwriting the history.
Before approving a handoff, look for these red flags:
- The chart is an image with no editable source data.
- Measurements have units but no definition of where the tape was placed.
- A product is marked oversized or cropped, but the chart contains no fit note.
- Several product families share a table without a documented reason.
- A “runs small” claim has no source, product scope, or measurement evidence.
Keep this record with the product source and use the SizeChartBase templates only as a formatting starting point; replace every sample value before publishing.